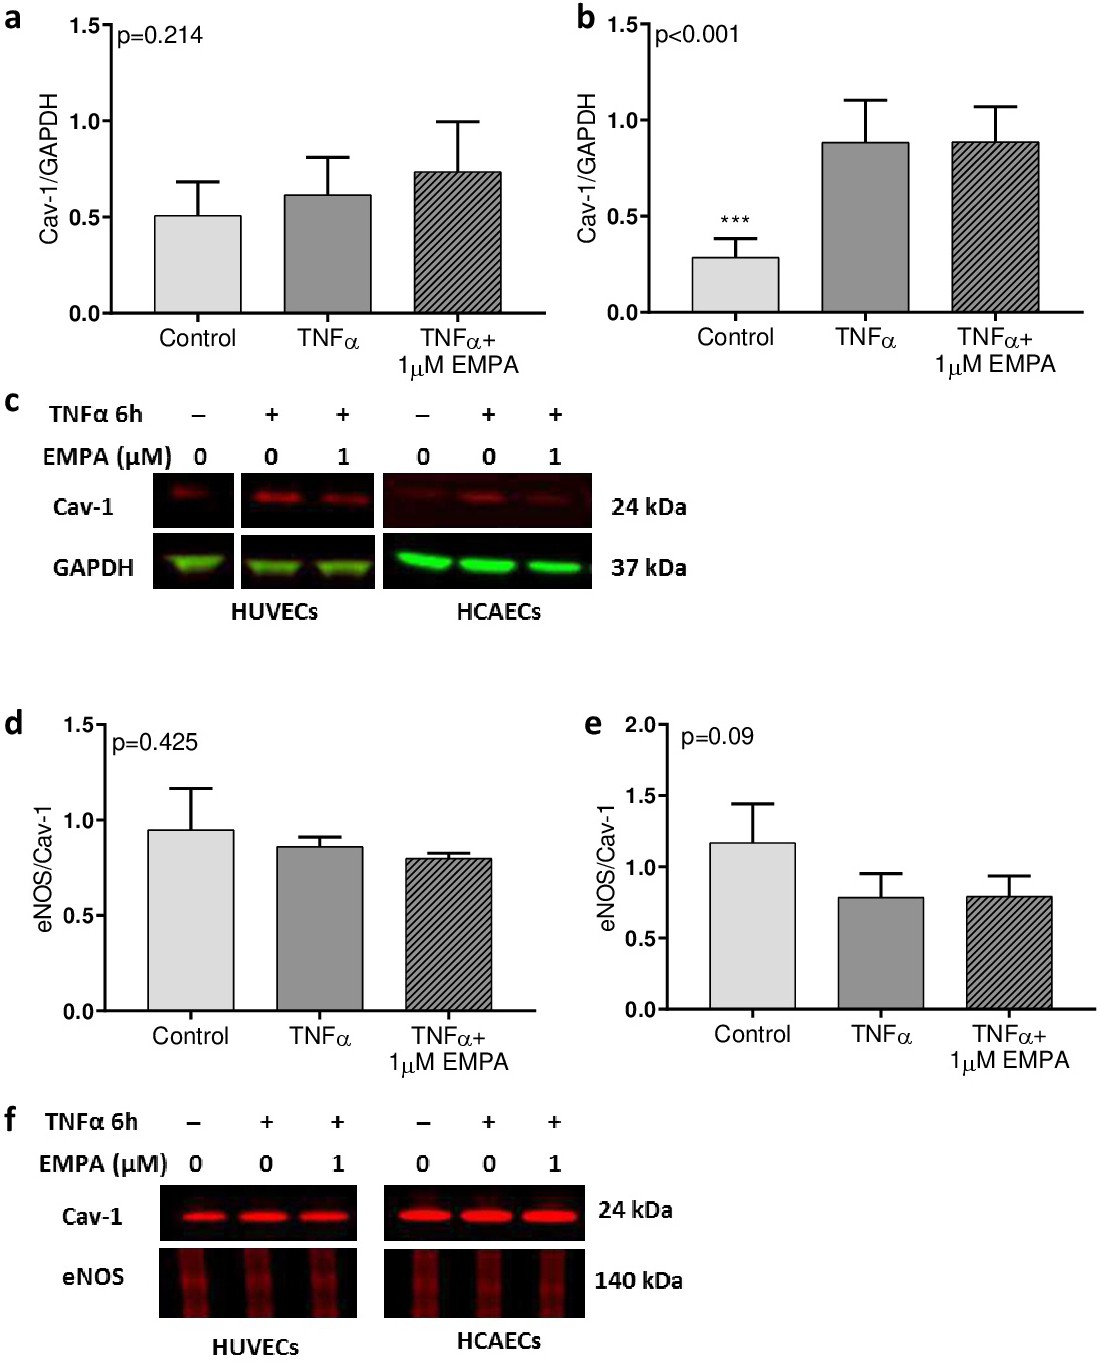
Fig. 4. Protein expression of Cav-1 and co-immunoprecipitation of eNOS/Cav-1 in endothelial cells treated with TNFα and EMPA. Cells were treated with 0.02% DMSO (control), 10 ng/mL TNFα or 10 ng/mL TNFα with 1 µM EMPA. Cav-1 (Cav-1) levels were determined after 6 h TNFα stimulation in HCAECs (a, n=6) and HUVECs (b, n=6). Representative images of Cav-1 western blots (c). GAPDH was used as internal control. Co-immunoprecipitation of eNOS and Cav-1 in HCAECs (d, n=3) and HUVECs (e, n=3). Representative images of co-immunoprecipitation are shown for HCAECs and HUVECs (f). Unrelated bands omitted for clarity. All full length blots can be found in the supplemental material. Data are presented as mean±SD. **p<0.01, ***p<0.001 vs. TNFα.